
Getting Started With a Basic Elastic SIEM Lab: A Step-by-Step Guide
- CyberSpeak Labs

- Jan 12, 2025
- 3 min read
Author: Hammaz Ahmed

Hey Readers!
I recently set up a basic SIEM lab using Elastic and wanted to share the steps I followed. It might be helpful for other entry-level folks like myself. Although I’ve worked with SIEMs like Splunk and Elastic for various certifications, I hadn’t had the chance to install and test them on my own computer before.
Before you start I took basic guidance from the Gerald Auger, PhD — Simply Cyber.
Here’s the link to his walkthrough — https://youtu.be/2XLzMb9oZBI?=faLUp2uXlhVzkxqR
Personally, I would recommend doing the lab on your own as much as possible.
Brief Overview
Setting up your free yet limited Elastic Account. (you don’t need a credit card to set it up. https://cloud.elastic.co/registration
Getting your Kali linux
Log Collection and doing a simple Nmap Scan.
Creating Dashboard.
Creating alerts.
Detailed Steps
You can easily do step 1 on your own. ;)
Step 2
After completing the account setup, you should see something similar to the screenshot below.

This step should be completed beforehand, but now it’s time to get your Kali VM.
Step 3
Log collection and doing a simple Nmap Scan.
Click on the hamburger sign and then “Add Integrations”.

Search for “Elastic Defend”, click on it, and click install.

Now, for the main part: you should see the screen shown below. We need to copy and paste the provided command into our Kali VM.

After a short while, the agent should be downloaded onto your VM. Once it’s complete, you’ll see a message saying “Elastic Agent has been successfully installed.” This means the agent will automatically collect logs and forward them to your Elastic setup.


Sometimes, you might encounter connectivity errors (as I did). If that happens, try pinging google.com to check if your connection is working.
Now the fun part, we will generate some logs to ingest in to our elastic instance.
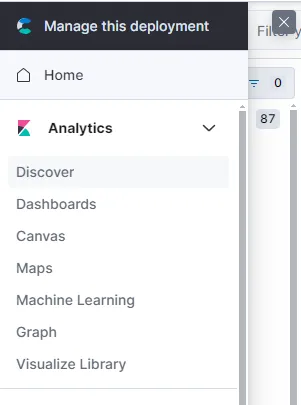
To view your logs, first click on the hamburger icon, then select “Dashboard.”
To verify if the logs are being ingested, I ran a simple “ping localhost” command, which pings my own Kali server.
From the below screenshots its obvious are pings command worked.


From the left sidebar, you can also see the originating host IP. In this case, 192.168.10.8 is the IP of my Kali VM.

Nmap scan
I did 2 basic Nmap scan on my VM.
nmap -p- localhost
sudo nmap -sS localhost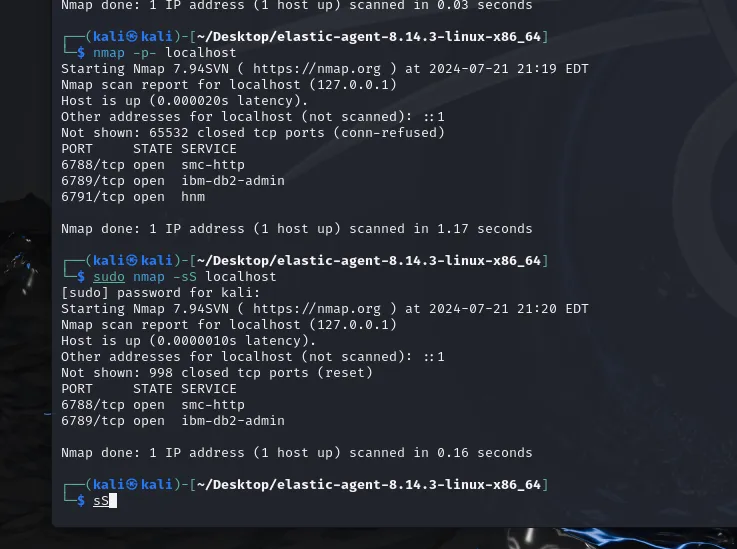
Step 4
Creating a Dashboard.
To see what Nmap performed, we’ll use three columns. From the left-hand bar, search for `process.args`, `process.commandline`, and `process.name`. Click on the “+” to add these columns for a clearer view.


Clicking on the names directly will provide a quicker view, as shown below.

Let’s create a dashboard because visuals are pretty cool, right? Click on the hamburger icon again and select “Dashboards.”
Click on “Create Dashboard”.

Next, click “Create Visualization.” On the right side, you can select the type of visualization you want. I chose a horizontal bar for my visualization. Click on the vertical axis and choose “timestamp.”
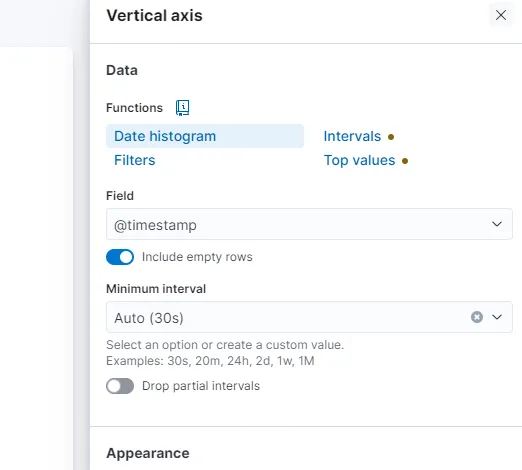
For the horizontal axis, choose “count.” This visualization helps us identify when there was a significant surge in traffic, which in our case is nmap scan traffic. Here’s my visualization dashboard: we can see that there was a traffic surge at 20:20.

Step 5
Creating an Alert
From the left side column, find “Alerts” under Security. On the right side, you’ll see “Manage Rules.” Click on it, then select “Create new rule.” You’ll see the following screen:

The “Custom query” option should already be selected. Scroll down and enter your alert query as shown below.

If you scroll further, you’ll find additional options to provide more information. I edited the alert name, added a brief description, and set a severity level.

I also created another rule for any activity related to my VM host IP. The results are shown below.


Conclusion
Setting up a basic SIEM lab with Elastic provides hands-on experience with log management and security monitoring. By following the steps to configure the Elastic Agent on a Kali VM, perform Nmap scans, and visualize the results, you gain valuable insights into network traffic and potential threats. Creating dashboards and alerts further enhances your ability to detect and respond to anomalies effectively. This practical exercise is a great way for entry-level professionals to develop their skills and deepen their understanding of SIEM tools.
Feel free to follow me on LinkedIn. :)
Checkout my website!


Comments